A data-driven approach to hepatitis C forecasting using machine learning and epidemiological models
The hepatitis C virus is a significant global health concern and a major cause of chronic liver disease. Therefore, developing a mathematical model is essential for understanding, controlling and managing its transmission dynamics. In this paper, we developed…
The hepatitis C virus is a significant global health concern and a major cause of chronic liver disease. Therefore, developing a mathematical model is essential for understanding, controlling and managing its transmission dynamics. In this paper, we developed a mathematical model and simulated the dynamics of transmission of the hepatitis C virus, considering alcohol use, a key factor contributing to increased damage to the liver of infected individuals. Computational investigation of nonlinear biological models by traditional numerical solvers is challenging due to their nonlinearity and inherent complexity. Furthermore, we proposed a deep learning-based technique to solve the nonlinear differential equations governing the model for transmission of the hepatitis C virus in six compartments. The proposed deep learning-based model is compared with other established methods like the Runge-Kutta method and Livermore solver for ordinary differential equations algorithm to validate its efficacy and accuracy in predicting hepatitis C dynamics. The basic reproduction number, R 0 , is calculated and stability is analyzed at both the disease-free and endemic equilibrium points. Sensitivity analysis is performed to determine key parameters that contribute to hepatitis C transmission. The results indicate that the proposed approach is an efficient and robust solution with better convergence and stability than existing methods. This study highlights the potential of deep learning methods in epidemiology as a promising tool for predicting and controlling infectious diseases such as hepatitis C, particularly in the presence of behavioral risk factors such as alcohol consumption.
Citation: Mannan A, Rahman JU, Alzahrani E, Fiidow OA (2026) A data-driven approach to hepatitis C forecasting using machine learning and epidemiological models. PLoS One 21(8): e0357173. Https://doi.org/10.1371/journal.pone.0357173
Editor: Mirza Mienur Meher, Gazipur Agricultural University, BANGLADESH
Received: May 11, 2025; Accepted: August 13, 2026; Published: August 31, 2026
Data Availability: All data are in the manuscript. We confirm that all the author-generated code supporting the findings of our manuscript has been made publicly available without restrictions. The code can be accessed at the following link: https://github.com/jamshaidwarraich/ODNN .
Funding: The author(s) received no specific funding for this work.
Competing interests: The authors declare that they have no conflicts of interest.
Hepatitis C is a significant health burden on the health systems of the world because of the development of potentially life-threatening conditions if the disease is not treated [ 1 ]. Despite considerable advances on the fronts of diagnosis and treatment, millions of people are infected with undetected or undertreated disease [ 2 ]. The most vulnerable populations, and especially the poorest sections of society in the poorest countries, have the highest disease burden as a result of minimal availability of medical resources and public health measures [ 3 ]. Pakistan, Egypt, and China have reported especially large numbers of cases, stressing the vital necessity of increased prevention and intervention measures [ 4 ].
Initiatives towards curbing the outbreak and effects of the virus have progressed through enhanced diagnostic methods and increasingly accessible antiviral drugs. International health agencies have established lofty goals of drastically lowering infection rates and accompanying fatalities over the next decade. At the heart of these aspirations stand mass screening, timely detection, and effective treatment protocols among susceptible populations [ 5 ]. Mathematical and computational models are of fundamental importance for predicting the trends of infection and designing effective health policies, enabling a more systematic approach to combating the epidemic [ 6 ].
Chronic alcohol use accelerates the development of liver injury in hepatitis C-infected individuals towards the development of severe liver disease [ 7 , 8 ]. Evidence shows that alcohol abusers have a higher likelihood of developing advanced liver fibrosis and cirrhosis than non-users [ 9 ]. Alcohol use and infection by HCV coexist for most cases, especially among those who have pre-existing liver conditions [ 10 ]. Alcohol use and disease management are made more complex by this comorbidity and present a formidable barrier towards the delay of hepatic damage progression, especially among populations where alcohol use is common [ 11 ].
Additionally, alcohol consumption seems to impair the success of antiviral therapies for the treatment of hepatitis C infection [ 12 ]. While the precise relationship is intricate, evidence indicates that heavy drinkers have weaker responses towards interferon-based regimens. Long-term alcohol abstinence, on the other hand, appears to be linked with enhanced therapeutic outcomes [ 13 ]. Some studies point towards the fact that alcohol abstinence over time augments the likelihood of a sustained virologic response (SVR), emphasizing the necessity of integrated treatment regimens that cover substance abuse as well as viral eradication [ 14 ].
Our model assumptions are reinforced by biological evidence indicating that high alcohol consumption exacerbates liver damage in individuals with HCV, leading to a higher likelihood of progression to chronic disease [ 15 ]. The model itself is a modification of existing compartmental models, specifically adapted to incorporate the effects of alcohol consumption on HCV transmission dynamics. The present research was carried out to determine the impact of low- and high-quantity alcohol consumption on patients infected with HCV. The mathematical model SFBHCR consists of six coupled nonlinear differential equations. Finding simulations of this type of ODE system is challenging. Artificial neural networks (ANNs), which are computationally effective approaches, can be used to determine the simulations of these differential equations.
According to the universal approximation theorem, every continuous function can be accurately approximated to an arbitrary level by a neural network having at least one hidden layer with a finite number of neurons and a nonlinear activation function [ 16 ]. A feedback mechanism, which is also called a backpropagation algorithm [ 17 , 18 ], is utilised by neural networks. Based on the discrepancy between the network’s actual and expected output, each unit’s weights are modified. These methods have continuous and differentiable solutions, show good interpolation features, and use less memory [ 19 , 20 ]. The necessity to retain just the weights of the neural network makes it less memory-intensive.
Once trained, the neural network provides a closed-form solution, allowing the answer to be recovered at any point within the solution domain. Having an easy-to-use application that helps researchers quickly set up and solve issues would be tremendously helpful, especially given the interest in developing neural networks to solve differential equations. Universal function approximators are multilayer perceptrons, the most basic kind of artificial neural networks (ANNs) [ 21 ]. This suggests that using ANNs to simulate the differential equations would be feasible. Previous studies have demonstrated that ANNs may simulate ordinary differential equations (ODEs) under certain initial/boundary conditions [ 22 ]. The inverse partial differential equations are simulated using ANNs [ 23 – 25 ], and partial differential equations in large dimensions are simulated [ 26 , 27 ]. Enforcing continuous symmetries in neural networks with knowledge of physics to solve forward and inverse PDE issues [ 28 ].
The neural network method is used for the parameter estimation of fractional discrete-time unified systems [ 29 ]. An artificial neural network framework for estimating the ideal value of the stabilisation parameter has been suggested [ 30 ]. Explain and illustrate the perceptron convergence technique for complex multivalued neural networks (BMVNNs), as well as several other important discoveries in the science of neural networks based on complex algebra [ 31 ]. Multi-layer neural networks are used to learn fractional difference equations through data-driven techniques [ 32 ]. Recently, researchers have addressed the Ebola virus disease model with a non-linear incidence rate using a Morlet wavelet neural network [ 33 – 35 ] and AI framework for opportunistic screening, staging, and progression risk stratification of steatotic liver disease [ 36 ]. Deep learning-based techniques have been used for the computational investigation and modelling of Marburg virus epidemics for health care [ 37 ] and the Van der Pol-Mathieu-Duffing oscillator model [ 38 ]. ANNs are utilised in the simulation and approximation of the biophysical model [ 39 ]. A deep neural network (DNN) is a special type of artificial neural network having two or more hidden layers.
Applications for deep neural networks in science and engineering are numerous and include voice recognition, picture processing, handwriting analysis, signature verification, and stock market forecasting, reflecting their role as interpretable deep learning models in modern computational systems [ 40 ]. The discretization of the domain is a necessary step in traditional approaches like the finite volume method (FVM), the Adams-Bashforth-Moulton approach [ 41 ], the finite element method (FEM), the finite difference method (FDM) [ 42 ], and the Runge-Kutta forward-backward sweep approach [ 43 ]. This is a challenging task that becomes more difficult with higher dimensions. Even though the DNNs approach does not require the discretization of the domain or use a mesh, it helps to mitigate some of the shortcomings of more conventional numerical methods. Fig 1 illustrates the architecture of the DNN, which consists of n hidden layers, each of which has n collaborating neurons. There is a single input layer, two or more hidden layers, and a single output layer in this network.
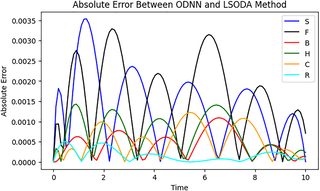
This paper investigates the transmission dynamics of the hepatitis C virus (HCV) using an oscillatory deep neural network-based approach, employing the SFBHCR model. The paper is structured as follows: Section outlines the mathematical modelling of a nonlinear coupled mathematical model for HCV transmission in the context of alcohol consumption. Section discusses the virus-free equilibrium point, the endemic equilibrium point, and the basic reproduction number R 0 . Stability analyses at both equilibrium points are examined in Section. Section consists of sensitivity analysis, which is conducted to identify the most influential parameters in the model. In Section, the proposed methodology is explained, including the architecture of oscillatory deep neural networks (ODNNs) and an algorithm detailing how ODNNs simulate the HCV transmission model. Section presents a numerical analysis of the HCV transmission model, comparing the outputs of the model using ODNNs against the RK4 method and the LSODA algorithm. Finally, Section summarises the conclusions drawn from the study and future direction.
A mathematical model was constructed to describe the recovery dynamics of HCV-infected individuals as a function of alcohol intake. The model classifies individuals according to the alcohol they drink: those who take small quantities of alcohol (less than one shot) and those who take large quantities (more than one shot). As illustrated by Fig 2 , the model follows the dynamics of the movement of the individuals between various compartments.
New susceptible individuals are added into the model at a rate of . Individuals who take alcohol at the lower level move into the F compartment at a transition rate of , and those who are heavy drinkers move into the B compartment at the rate of . The transitions from S to F at rate and from S to B at rate represent behavioral shifts influenced by social and environmental factors rather than direct infection.
Alcohol consumption, driven by peer pressure or personal choices, increases engagement in risky behaviors such as needle sharing or unprotected contact, which heightens HCV transmission risk. Biologically, excessive alcohol weakens the immune system, making individuals more susceptible to infections. These transitions reflect how individuals gradually move into higher risk categories, even without initial exposure to the virus. Thus, the model captures an indirect but significant pathway that contributes to the spread of HCV. The transitions from F and B to H at rates and are biologically justified by the strong correlation between alcohol use and high-risk behaviors leading to HCV transmission.
Studies show that alcohol consumption significantly increases the likelihood of engaging in unsafe practices, such as needle sharing, unprotected contact, or other risky behaviors that directly expose individuals to HCV. In addition, alcohol impairs judgment and decision-making, further increasing the probability of infection. These transitions explain the epidemiological reality that individuals in F and B have a higher probability of contracting HCV due to behavioral risks rather than direct force of infection alone. Thus, and reflect the real-world pathways through which alcohol consumption indirectly but substantially contributes to the acquisition of HCV.
Susceptible ( S ) move into the hyperacute compartment ( H ) at the rate . The small alcohol drinkers ( F ) have the option of transiting into the large alcohol drinkers ( B ) at the rate , while the large alcohol drinkers ( B ) have the ability of decreasing the quantity of alcohol they intake and coming back into the category of small alcohol drinkers ( F ) at the rate . The hyperacute compartment ( H ) progresses to the chronic compartment ( C ) at the rate . The chronic compartment ( C ) recovers at the rate . Recovered compartment ( R ) individuals may return to susceptibility at rate . D and refer to the “new recruitment rate” and the “death rate,” respectively. The model of the system represented by Fig 2 is as follows:
where with S > 0, , , , , and S + F + H + B + C + R = N . represents the recruitment rate of susceptible individuals into the population, which biologically accounts for new individuals entering the system through birth or immigration. It determines the influx of susceptible who may later become infected, impacting HCV transmission dynamics. Tables 1 and 2 explain the parameters of the SFBHCR model. By adding the above system of Eq 1 and we get,
Therefore, Eq 4 shows the viable area for the above systme of Eq 1 is,
For verification of the accuracy and uniformity of the presented model, we now do a dimensional system of Eq 1 analysis. Analysis ensures that all the terms in every differential equation are dimensionally homogeneous, required for the biological interpretability of the model.
The state variables all represent the number of individuals. Accordingly, the dimensions of the state variables are
On the left-hand side, ( ). All of the terms on the right-hand side also have the same dimension .
Recalling the test on the remaining compartments ( F , B , H , C , R ) establishes that all of the terms in the system are dimensionally consistent. Thus, system of Eq 1 is dimensionally homogeneous, both sides of every equation in ( ). This attests to the mathematical stability and biological importance of the model.
By using stability analysis, which is based on the system of Eq. 1 , the disease-free equilibrium point can be found. System of Eq 1 must all equal zero to determine the equilibrium point, which means:
Now, we determined disease free equilibrium and endemic equilibrium points
The equilibrium points of a Virus free state are those points where disease does not spread, which are F = 0, B = 0, H = 0 and C = 0. After solving the system of Eq 5 , we determine the Virus free equilibrium point that is .
After solving the system of Eq 5 , we determine the endemic equilibrium point that is given by Eq 6 ,
The basic reproduction number, R 0 , is a key epidemiological threshold parameter used to characterize the dynamics of the endemic model. It represents the average number of secondary infections produced by a single infectious individual in a completely susceptible population. The value of R 0 governs the qualitative behavior of disease transmission. In particular, if R 0 < 1, the disease will eventually die out, whereas if R 0 > 1, the disease persists and becomes endemic in the population. Consequently, public health interventions such as vaccination, treatment strategies, and quarantine measures are often designed and evaluated based on the magnitude of R 0 . Theorem 1 proves the disease-free equilibrium’s stability by showing eradication of the infection as a result of keeping R 0 < 1. Through the next generation matrix method [ 45 , 46 ], R 0 equals the spectral radius of the matrix gq -1 , where g and q are the Jacobians of G and Q , respectively. Let the state of the system be defined as Y = ( S , F , B , H , C , R ).
where Q(x) indicates how people move among compartments and G(X) indicates the rate at which new cases of infection are produced. This gives us
At virus free equilibrium point , the derivatives of G and Q are now calculated, obtaining matrices g and q which are:
Thus, the required basic reproduction number is given by Eq 7
This section contains the model’s stability analysis. It is now needed to determine the Jacobian matrix based on system Eq 1 to examine stability. First, we find the Jacobian matrix at the virus free equilibrium point that is:
The jacobian matrix J ( P 1 ) have the following eigenvalues:
It should be noted that in the proposed model, all the parameters are taken to be positive. With this, all the eigenvalues , , , , , and of the Jacobian matrix J ( P 1 ) have negative real parts. It implies that R 0 < 1 and the disease-free equilibrium P 1 is locally asymptotically stable. Stability at the disease-free state thus ensures that there can be no outbreak or pandemic risk in the population.
Now, we find the Jacobian matrix at the endemic equilibrium point that is:
Reported by Plos.org · presented in full by the Europes Room.